



Your support team answers the same password reset question 47 times this week. Meanwhile, your knowledge base has three different articles about passwords, but customers keep opening tickets anyway. The disconnect? You're writing articles based on what you think customers need, not what they're actually searching for when they hit your help center.
Most support teams treat knowledge base creation like documentation—write it once, publish it, hope it helps. The teams actually cutting ticket volume by 30-40% treat it more like a product cycle. They track search queries, run content experiments, and measure impact on specific ticket categories. They don't just write articles; they build a process that turns repetitive tickets into findable, usable self-service content.
The search-first prioritization trap
Your analytics show customers search "cancel subscription" 800 times a month. So you write the perfect cancellation article. Traffic looks great. Cancellation tickets don't move.
Why? Because customers searching "cancel subscription" already decided to cancel. They want a button, not an article. Meanwhile, the 200 people searching "pause account" or "skip next month" are the ones actually opening tickets because they can't find what they need.
High search volume doesn't equal high ticket reduction potential. A search query with 50 monthly searches generating 45 tickets is more valuable to fix than one with 500 searches generating 10 tickets.
Running support ops for a meal kit company drove this home for me. Our most-searched term was "skip delivery"—around 3,000 searches monthly. But those users rarely opened tickets. They either found the skip button or churned. The real problem was 180 people searching variations of "vacation hold" who couldn't find our pause feature and ended up contacting support to ask how to temporarily stop deliveries.
Your search analytics need two data points, not one:
-
Search volume (what customers look for)
-
Ticket correlation (which searches actually lead to tickets)
Without both, you're optimizing for traffic, not deflection.
Build your ticket-to-article conversion pipeline
The most effective teams don't just analyze—they systematize.
Never let a customer request slip through the cracks.
Helpyly helps you track, resolve, and optimize every support interaction effortlessly.
- Centralized ticket management
- Automated customer notifications
- Performance analytics dashboard
No credit card required
Weekly ticket mining session (30 minutes) Pull your last 500 tickets. Group them by root cause, not category. "Password reset" isn't a root cause—"can't find reset link in email" or "reset email going to spam" are root causes. Each root cause is a potential article.
Pay attention to how customers describe problems. If 40% say "locked out" instead of "password reset," your article title needs "locked out" in it, not just "password reset."
Search query mapping (weekly, automated) Export your help center search queries. Match them against existing articles using partial string matching. Any query with more than 20 searches monthly and under 50% click-through goes on your content gap list.
Cross-reference with ticket subjects. Queries that appear in both lists are priority one—customers are searching and not finding answers.
Content experiment framework Don't just publish and hope. Run actual experiments:
Week 1-2: Baseline measurement. Tag all tickets in your target category.
Week 3-4: Publish the new article. Don't announce it—let organic search find it.
Week 5-6: Add the article to your chatbot's suggested articles for related queries.
Week 7-8: Include the article link in your ticket auto-response for that category.
Measure ticket volume at each stage. This tells you whether the problem is discoverability or content quality.
A subscription box company tried this with "update payment method" tickets. The new article alone dropped tickets 15%. Adding it to chatbot suggestions pushed that to 35%. But the auto-response link barely moved anything—by the time someone opened a ticket, they wanted a human, not another link.
Group tickets by root cause, not category, to find real article candidates.
Here's a simple workflow of the pipeline.
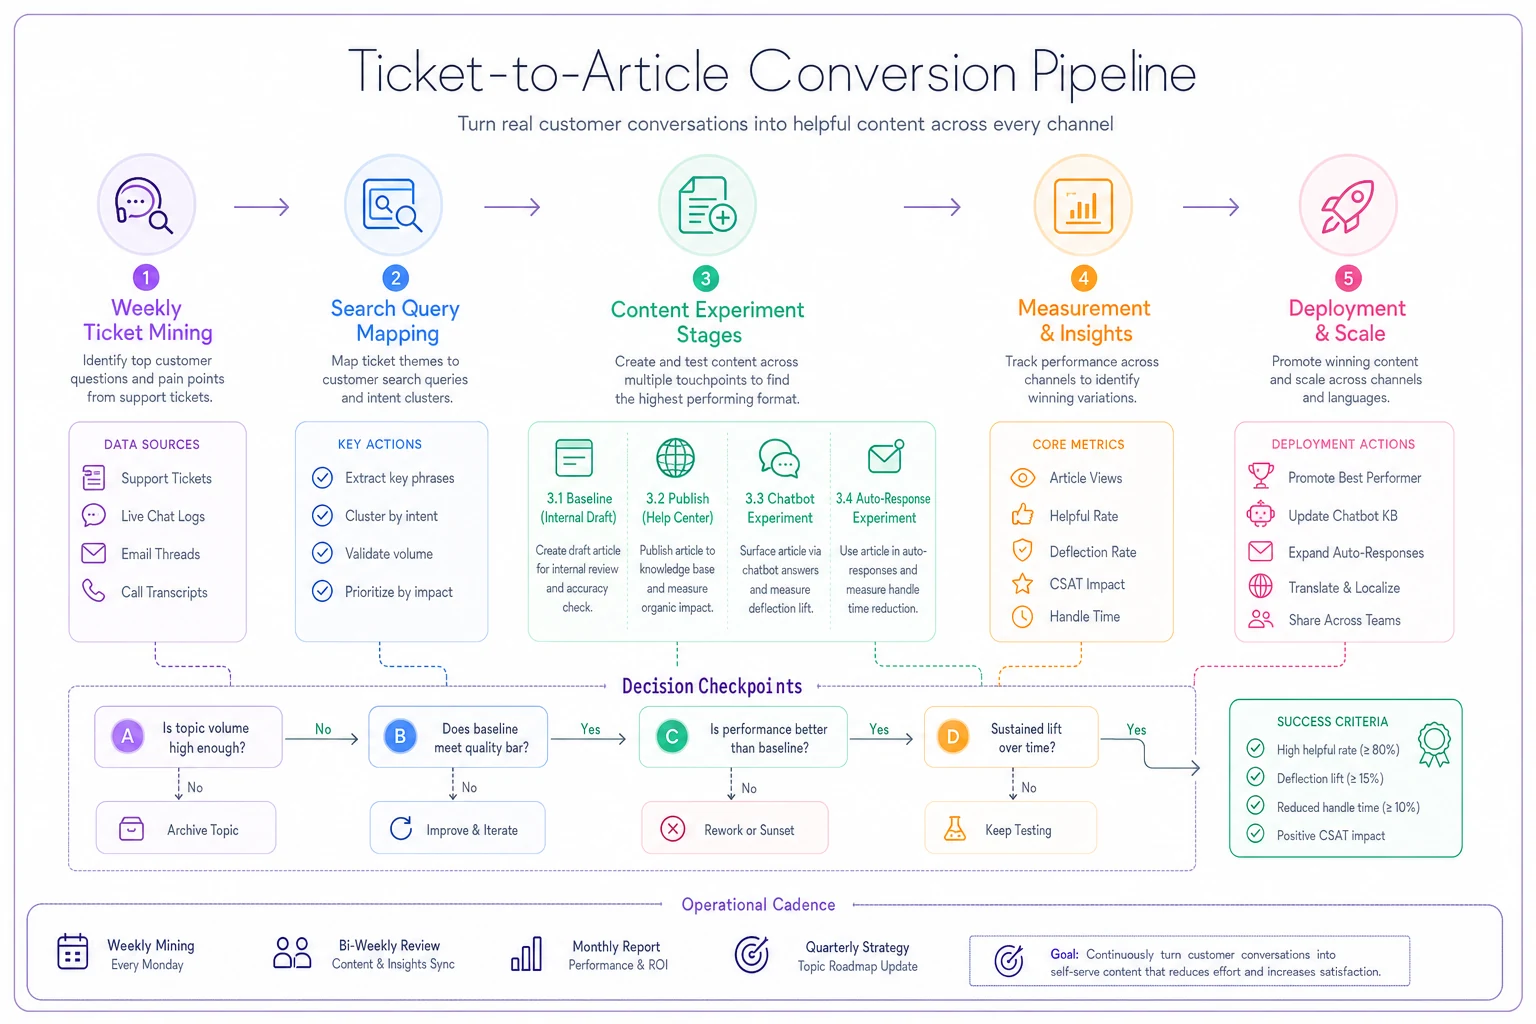
Use this as a reference when you run your weekly cycle.
The measurement reality check
Most teams track article views or helpfulness ratings. Views don't equal ticket reduction though. An article can get thousands of views while tickets keep climbing—it just means customers read it and then opened a ticket anyway.
Track these instead:
-
Deflection rate by category Tickets in category this month ÷ tickets in category baseline month Run this for each article's target ticket type Under 20% reduction means the article isn't working
-
Search-to-ticket ratio Tickets with subject matching search query ÷ total searches for that query Under 5% is good, 5-15% needs work, over 15% is a content emergency
-
Time-to-republish Days between article publish and first ticket that says "I read the article but..." Under 7 days means your article has gaps
Articles that reduce tickets by more than 30% tend to share three things: they use the exact words customers use in tickets (not internal terminology), they include screenshots of every step, and they address the "what if" scenarios that generate follow-up questions.
Your content experiment playbook
Here's roughly how the experiment staging looks in practice. Each phase has a clear job—don't skip ahead just because early numbers look promising.
| Experiment Stage | Duration | Success Metric | Failure Trigger |
|---|---|---|---|
| Baseline | 2 weeks | Document ticket volume | N/A |
| Soft launch | 2 weeks | 10% ticket reduction | <5% reduction |
| Channel test | 2 weeks | Additional 15% reduction | No incremental improvement |
| Full deployment | Ongoing | 25%+ total reduction | Regression to baseline |
Soft launch tactics Publish the article but don't promote it. Let it accumulate organic traffic. This tests whether your content actually solves the problem when customers find it on their own.
Watch these signals:
-
Time on page (under 30 seconds = customers bouncing)
-
Scroll depth (under 50% = the answer isn't findable)
-
Related ticket subjects (new phrasing showing up = content gaps)
Channel testing sequence Once content proves itself organically, test distribution:
-
Add to internal knowledge base for agents (reduces handle time first)
-
Include in help center search results
-
Add to chatbot suggestion logic
-
Include in automated ticket responses
-
Proactively send to at-risk customers
Each channel should show incremental improvement. If adding to chatbot doesn't move tickets further, either the targeting is off or you've hit natural deflection limits.
Watch for the three failure modes
Failure Mode 1: The moving target You write an article about downloading invoices. Tickets drop 40%. Two months later, tickets spike again. Your product team redesigned the billing page and moved the download button.
The fix: Build a review trigger system. Any product change affecting more than 10 tickets monthly should trigger a documentation review. Connect your product release notes to your knowledge base audit calendar.
Failure Mode 2: The comprehension gap Your article is technically correct but customers don't follow it. They search "stop emails," find your article about "managing notification preferences," read two sentences, and open a ticket anyway.
The fix: Write at an 8th grade reading level. Use the words customers use, not the words your product team uses. If customers say "turn off emails," don't title the article "adjust communication settings."
Failure Mode 3: The trust deficit Some problems are emotional, not informational. Billing error tickets won't deflect to articles because customers want confirmation a human actually saw their issue. Security concern tickets won't deflect because customers need reassurance, not instructions.
Accept that not all tickets should become articles. Track your "emotional ticket percentage"—usually somewhere in the 20-30% range. These need human touch or AI-assisted responses that acknowledge the concern before jumping into information.
The compounding effect
When you run this process consistently, your ticket mix changes. Month one, you're writing articles about password resets and billing questions. Month six, you're writing about edge cases and complex workflows. The boring tickets got automated away, so the interesting ones are all that's left.
A team running e-commerce support tracked this over a year: Month 1: 60% repetitive, 40% unique tickets Month 3: 45% repetitive, 55% unique Month 6: 25% repetitive, 75% unique Month 12: 15% repetitive, 85% unique
Headcount stayed flat while transaction volume doubled. Agents spent more time on real problems. Customer satisfaction went up because simple questions got instant answers while complex ones got actual expert attention.
The math is pretty straightforward. If you handle 1,000 tickets monthly and cut repetitive tickets from 60% to 20%, you've freed up 400 ticket-handling hours. That's roughly 2.5 FTEs worth of capacity, without adding anyone.
Build your measurement dashboard
Track these weekly:
-
Ticket reduction metrics Total tickets by category (week-over-week) Tickets per article (which content actually deflects) Search-to-ticket conversion rate (where content fails)
-
Content health metrics Article age since last update Product changes affecting articles in the top-10 ticket drivers Articles sitting under 20% deflection rate
-
Experiment pipeline metrics Articles currently in experiment Experiments meeting success criteria Average time from identification to publication
The teams that get results treat this like product development. They have a backlog, run experiments with clear success criteria, kill articles that don't perform, and treat deflection wins like product launches.
Where AI automation actually helps
Modern operational platforms can speed up this whole cycle without replacing the judgment calls. AI-powered analysis can spot ticket clusters automatically, surfacing patterns a human might miss in a 500-ticket export. Natural language processing can match customer language to internal terminology and suggest article titles people will actually search for.
The more practical value is in automated measurement. Instead of manually tracking which articles correlate to ticket drops, AI-assisted platforms can do that correlation for you, accounting for seasonality and other noise. They can flag when articles need updates based on new ticket patterns emerging around existing content.
Some platforms now auto-generate article drafts from ticket clusters—pulling actual customer language and edge cases from real tickets. The draft isn't publish-ready, but it gets you 70% of the way there faster than starting from scratch.
The automation doesn't replace the judgment about what deserves an article or how to structure content for comprehension. It just compresses the discovery, measurement, and iteration cycle so you can run more experiments without burning out your team.
Start this week
Pick your most annoying ticket category. The one that makes agents groan when they see it. Pull 50 recent tickets from that category. Look for the exact words customers use. Check whether those words appear in your existing articles.
They probably don't.
Write one article using customer language. Cover every edge case from those 50 tickets. Add screenshots for every step. Publish it quietly. Tag incoming tickets in that category for the next two weeks.
The teams reducing repetitive tickets by 40% aren't better funded or unusually smart. They just treat knowledge base content like an operational system instead of a documentation project. They measure what matters: tickets prevented, not articles published.
Your customers are telling you exactly what to write every time they open a ticket. The question is whether you're listening systematically or just reacting. That difference determines whether you're still answering the same password reset question a year from now.
Ready to elevate your customer support?
Join 2,000+ support teams using Helpyly to reduce response times, automate workflows, and deliver outstanding customer experiences.