



Most support dashboards are decorated, not used. There's a wall of tiles — CSAT, average handle time, first response time, backlog count — and everyone glances at them in the Monday meeting, nods, and goes back to firefighting. The metrics exist. The decisions don't move.
The gap isn't a lack of data. It's that nobody has drawn the line between "this number changed" and "so we do this thing." A KPI without an attached decision is just decoration. And most of the numbers people obsess over are lagging — they tell you what already happened weeks after you could have done anything about it.
This is a playbook for wiring the whole thing together: which support leading indicators actually predict trouble, which lagging KPIs confirm outcomes, what decision cycle each one belongs to, how to run experiments that don't lie to you, and what runbook triggers should fire automatically when a signal crosses a line.
The two-layer problem: leading vs lagging, and why teams confuse them
The mistake almost everyone makes: they treat CSAT as their steering wheel. But CSAT is a rearview mirror. By the time it drops, the customers who were annoyed have already been annoyed, some have churned, and survey responses trickled in over three weeks. You can't steer with it. You can only grade yourself with it.
Leading indicators are the ones that move before the outcome you care about. Lagging indicators confirm whether your leading indicators were right. Both matter — but they belong to completely different decision cycles.
A quick way to sort any metric: ask "if this changes today, when do I feel the consequence?" If the answer is "in a few hours," it's probably a leading signal you can act on. If the answer is "next month," it's a lagging outcome you use to validate.
| Metric | Type | What it predicts / confirms | Decision cycle |
|---|---|---|---|
| Backlog growth rate (tickets in vs out per hour) | Leading | SLA breaches later today | Hourly / intraday |
| First response time trend | Leading | CSAT decline this week | Daily |
| Reopen rate | Leading | Escalations and refunds | Weekly |
| % contacts on a single topic | Leading | Incoming spike, product bug | Hourly |
| Handle time variance by agent | Leading | QA problems, training gaps | Weekly |
| CSAT / CES | Lagging | Whether changes worked | Monthly |
| Churn attributable to support | Lagging | Revenue impact | Quarterly |
| Cost per resolved ticket | Lagging | Efficiency of process changes | Monthly |
The point isn't the specific metrics — swap in your own. The point is that every metric has a natural rhythm, and if you review it on the wrong cadence you'll either overreact to noise or notice damage too late.
Match the metric to the decision cycle, not the other way around
Most support teams run everything on one cadence: the weekly ops meeting. Backlog gets discussed weekly. CSAT gets discussed weekly. Staffing gets discussed weekly. That's the root problem. Backlog moving badly on a Tuesday afternoon doesn't care about your Thursday meeting.
Never let a customer request slip through the cracks.
Helpyly helps you track, resolve, and optimize every support interaction effortlessly.
- Centralized ticket management
- Automated customer notifications
- Performance analytics dashboard
No credit card required
Think of it as three loops running simultaneously:
The intraday loop (hours). This is where leading indicators earn their keep. Backlog growth rate, contact reason concentration, queue wait times. These need automated thresholds because no human is reliably watching a dashboard at 2pm on a busy day. When ticket inflow outpaces resolution by more than roughly 20% for two consecutive hours, something is wrong — a bug, a botched release, a payment outage. The decision isn't "discuss it later," it's "reroute now."
The weekly loop (days). Reopen rate, first response time trends, handle time spread across the team. Not emergencies, but they predict next month's lagging numbers. A reopen rate creeping from 8% to 13% over three weeks is a quiet alarm — it means you're closing tickets that aren't actually resolved, and those customers come back angrier.
The monthly/quarterly loop. CSAT, cost per ticket, support-attributable churn. These are your scoreboard. You don't react to them — you use them to judge whether the reactions you took in the faster loops were right.
The most common failure is collapsing all three into one meeting. The second most common is the opposite: watching intraday signals so obsessively that every small wiggle triggers a fire drill. Both burn the team out and neither improves outcomes.
The signal-to-decision map
For every leading indicator you actually track, you should be able to fill in this sentence: "When crosses , for long, we do , and we verify it worked by watching ___."
If you can't finish that sentence, drop the metric.
-
Signal reopen rate on billing tickets
-
Threshold above 15% (baseline sits around 7–9%)
-
Duration sustained across a full week, not a single day
-
Action pull a sample of 20 reopened billing tickets, identify whether it's a knowledge gap or a genuine product/process issue
-
Verify with reopen rate returning toward baseline over the following two weeks, plus a dip in billing-related escalations
Notice the duration requirement. Single-day spikes lie constantly. A Monday after a long weekend always looks ugly. Requiring a sustained move before you act cuts false alarms significantly.
Running support experiments that don't fool you
A lot of teams go sideways here. They change a canned response, or a routing rule, then look at CSAT the next day and declare victory or disaster. That reading is almost always noise. Support metrics are noisy at small volumes, and daily CSAT with a handful of responses tells you nothing.
An experiment needs three things decided before you start: the metric, the measurement window, and the sample size. Skip any of these and you'll retrofit a story onto whatever the numbers happened to do.
-
Pick one metric that will move first. If you're testing a rewritten troubleshooting macro, the leading metric is reopen rate on that topic, not overall CSAT. CSAT is too slow and too broad to isolate one macro's effect.
-
Estimate your baseline and its natural swing. If reopens on that topic run 10% and bounce between 7% and 13% week to week, that ±3 swing is your noise floor. Your experiment has to beat it clearly to mean anything.
-
Decide the sample size before you look. Rough rule for support
to detect a few-percentage-point move in a rate metric, you typically need a few hundred tickets per arm — often 300–500 each for anything subtle. If a topic only gets 40 tickets a week, accept that your experiment will take a month, or that you can only detect large effects.
-
Set the measurement window and freeze it. Two weeks per arm is a reasonable default for weekly-cadence metrics. Write the end date down. The temptation to "just check early and stop when it looks good" is how teams fool themselves — early peeking inflates false positives badly.
-
Split cleanly. Route by ticket ID parity, or by alternating assignment, not by agent or by time of day. If arm A is all your senior agents and arm B is all your juniors, you didn't test the macro, you tested the agents.
-
Read the result once, at the end. Then decide
ship, kill, or extend.
A realistic sizing example: a team wants to test whether a more detailed refund macro lowers reopens. Refund tickets run about 250 a week. Baseline reopen is ~12%. They want to detect a drop to ~8%. Splitting traffic in half gives 125 tickets per arm per week — too thin for a clean read in one week, so they run it three weeks, landing near 375 tickets per arm. That's enough to trust a 4-point move. Rushing it to one week would have produced a confident-sounding but meaningless number.
When experiments make sense — and when they don't
Experiments are worth the overhead when the change is reversible, the volume is high enough to read, and the downside of being wrong is real (money, churn, legal). Testing canned responses, routing tweaks, and macro rewrites all qualify.
They're a bad idea when volume is tiny, when the change is a one-way door (you can't un-tell a customer something), or when you already know the answer and you're just running an experiment to look rigorous. For low-volume topics, a qualitative review of 20–30 tickets often teaches you more than an underpowered A/B test that will never reach significance.
Some teams should not be running experiments at all yet. If your data is inconsistent — tickets miscategorized, contact reasons entered by hand and half wrong — fix measurement first. An experiment on top of garbage tagging just launders bad data into false confidence.
Runbook triggers: turning signals into automatic action
Leading indicators only help if someone — or something — acts on them fast. Relying on a human to notice a threshold crossing on a dashboard is the weak link. People are in meetings, on tickets, or asleep.
This is where the boundary between "monitoring" and "response" needs to be explicit. A trigger is a pre-decided rule: this condition → this action, written down before the stress hits. The value of writing it down in calm times is that nobody has to make a judgment call mid-crisis.
A short set of runbook triggers a mid-size team might keep:
-
Backlog inflow > outflow by 20%+ for 2 hours → notify the on-call lead, open temporary overflow queue, pause non-urgent internal work.
-
Single contact reason > 30% of new tickets in an hour → flag for possible incident, ping product/engineering, prep a holding response.
-
First response time crosses SLA warning line → auto-surface aging tickets to the top of queues, page a second-shift agent if available.
-
Reopen rate on any topic > 15% for a week → auto-create a review task, sample 20 tickets, route to knowledge owner.
-
Median wait time doubles versus rolling baseline → activate templated status messaging so customers aren't left guessing.
The trick with triggers is calibrating thresholds so they fire rarely enough to be credible. A trigger that goes off every day gets ignored within a week — same psychology as a car alarm nobody looks at. Tune them against a few weeks of historical data first: pick thresholds that would have fired on your genuinely bad days and stayed quiet on normal ones.
Modern support platforms increasingly let you wire these thresholds directly into workflow automation, so a signal crossing a line can open the overflow queue or reprioritize aging tickets without a human relaying the message. That removes the delay between "the number moved" and "we responded" — which on a busy day is often the difference between a contained blip and a full SLA breach. The automation isn't the strategy. The pre-decided rules are. The tooling just makes sure the rules actually run.
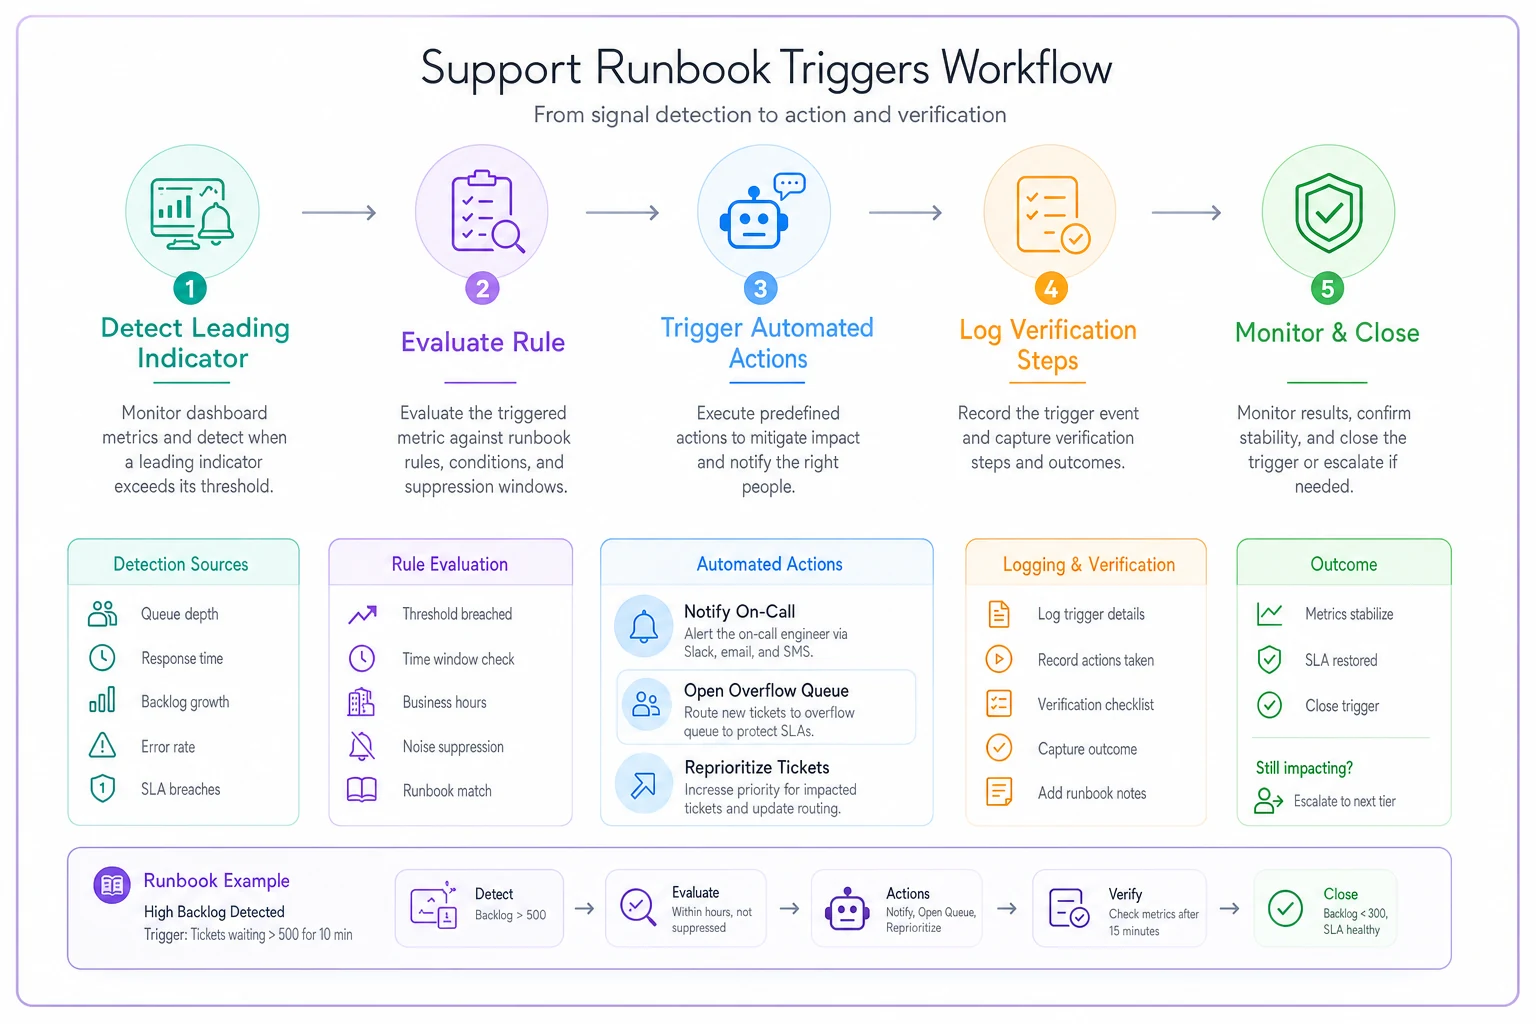
The flow below shows how a threshold maps to automated actions and notifications.
A real scenario: a SaaS support team that stopped watching the wrong number
A subscription software company with a support team of around a dozen agents was fixated on CSAT. It hovered around 89%, dipped occasionally, and every dip triggered a round of hand-wringing that produced no actual change — because by the time they saw a dip, the cause was three weeks cold.
They rebuilt around leading indicators. Reopen rate and contact-reason concentration became the daily and hourly watch items. Reopens, it turned out, were sitting around 14% — much higher than anyone realized, because nobody tracked it. Roughly a third of those reopens traced back to two vague macros that technically answered the question but left customers confused enough to write back.
They ran a proper experiment on those two macros: rewrote them, split traffic, ran it about three weeks with a few hundred tickets per arm. Reopens on those topics dropped to the 8–9% range. Overall reopen rate settled closer to 10%. CSAT didn't spike dramatically — it drifted up a couple of points over the following two months — but the more meaningful win was quieter: escalations tied to those topics fell noticeably, and agents stopped re-handling the same conversations over and over.
The lesson wasn't "reopen rate is the magic metric." It's that they finally had a leading signal on a fast enough cycle to act, an experiment structured well enough to trust, and a review trigger that fired automatically when the number crept back up. CSAT was still there — but as a scoreboard, not a steering wheel.
Where teams go wrong wiring this up
A few patterns show up repeatedly when teams try to build this and it doesn't stick:
-
Too many metrics, no decisions attached. If a metric doesn't finish the "when this crosses X, we do Y" sentence, it's noise. Cut it.
-
Wrong cadence. Reviewing intraday signals weekly, or agonizing over monthly lagging numbers daily. Match each metric to its natural loop.
-
Experiments read too early. Peeking and stopping when it looks good produces confident nonsense. Freeze the window.
-
Triggers that fire constantly. Alarm fatigue kills the whole system. Calibrate against real history.
-
Measuring on top of bad tags. If categorization is wrong, every downstream number is wrong. Fix inputs before you fix analysis.
Metrics are only useful inside a system — where signals map to decisions, decisions run on the right cadence, experiments are honest, and responses are pre-wired. A dashboard alone gives you none of that. It just gives you something to look at while the backlog grows.
The teams that stop guessing aren't the ones with the fanciest dashboards. They're the ones who did the boring work of connecting each number to a decision, deciding in advance what would trigger action, and refusing to read experiments before they're ready. Leading indicators tell you where you're heading; lagging KPIs tell you whether you were right; the decision cycles and triggers are the machinery that turns both into action instead of anxiety.
Start with one signal. Attach one decision. Wire one trigger. Run one honest experiment. That single loop, working end to end, teaches you more than a wall of tiles ever will — and it's the piece almost every support org is missing.
Ready to elevate your customer support?
Join 2,000+ support teams using Helpyly to reduce response times, automate workflows, and deliver outstanding customer experiences.