
Your support team gets blindsided by ticket spikes because you're looking at yesterday's reports instead of real-time patterns. By the time someone notices the queue tripling, half your customers have already tweeted complaints and your agents are drowning in backlog that takes days to clear.
Support ticket anomaly detection isn't about fancy dashboards showing you problems after they happen. It's about catching deviations from normal patterns early enough to actually do something — shift resources, trigger automated responses, or alert the right people before small spikes turn into multi-day backlogs.
The difference between reactive firefighting and proactive management comes down to three operational components: statistical detectors that understand your actual patterns (not generic thresholds), routing playbooks that execute automatically when triggers hit, and short-term mitigations that buy time while permanent fixes get implemented.
Why generic thresholds miss the real spikes that matter
Most support teams set up basic alerts like "notify when queue hits 100 tickets" without accounting for the fact that 100 tickets on Monday morning means something completely different than 100 tickets on Friday night. Your normal Tuesday afternoon volume might be 40 tickets per hour, but during month-end billing it jumps to 85 — neither is actually anomalous for that specific context.
The teams that catch problems early build baselines that account for multiple dimensions of normal variation. A subscription box company handling around 2,800 tickets monthly discovered their "high volume" alerts were firing constantly because they didn't factor in delivery week patterns. Every third week when shipments went out, ticket volume would spike 3x for exactly 48 hours, then drop back to baseline. Their generic threshold of 50 tickets per hour was either alerting unnecessarily or missing genuine anomalies hidden within expected spikes.
Statistical detection that actually works needs to understand:
-
Hour-of-day patterns (lunch rush vs overnight)
-
Day-of-week cycles (Monday morning surge vs weekend lull)
-
Monthly patterns (billing cycles, payroll weeks)
-
Seasonal variations (holiday shopping, tax season)
-
Event-driven spikes (product launches, marketing campaigns)
Without this context, you're either ignoring real problems or crying wolf so often that your team stops responding to alerts entirely.
Building detection baselines from your actual patterns
Effective anomaly detection starts with understanding what "normal" looks like across different time windows. You need at least 90 days of historical data to build reliable baselines, though 6 months gives you better seasonal coverage.
Never let a customer request slip through the cracks.
Helpyly helps you track, resolve, and optimize every support interaction effortlessly.
- Centralized ticket management
- Automated customer notifications
- Performance analytics dashboard
No credit card required
Here's the operational breakdown for setting up working baselines:
Phase 1: Data Collection (Weeks 1-2) Collect hourly ticket volumes segmented by:
-
Channel (email, chat, phone, social)
-
Category (billing, technical, shipping, account)
-
Priority level
-
Customer tier (if applicable)
Don't average everything together. A spike in password reset tickets means something different than a spike in refund requests.
Phase 2: Pattern Identification (Week 3) Map out your recurring patterns. A B2B software company with roughly 1,200 monthly tickets found these:
-
Mondays
35% above weekly average
-
Post-release days
250% spike for 6 hours
-
Month-end
40% increase days 28-31
-
Lunch hours
20% dip from 12-1pm EST
Phase 3: Threshold Calculation (Week 4) Set detection thresholds based on standard deviations from expected values, not fixed numbers:
| Threshold | Definition |
|---|---|
| Warning | 2 standard deviations above expected |
| Alert | 3 standard deviations above expected |
| Critical | 4 standard deviations or sustained 3-sigma for 2+ periods |
This means if Tuesday 2pm normally sees 25-35 tickets, your warning triggers at 45, not at some arbitrary "50 tickets" threshold that ignores context.
Phase 4: Sensitivity Tuning (Ongoing) Start with conservative thresholds and tighten gradually. Track false positive rates weekly. Aim for fewer than 2 false alerts per week while catching 95% of genuine anomalies.
Start with conservative thresholds and track false positives weekly to find the balance between noise and missed incidents.
Start with conservative thresholds and tighten gradually. Track false positive rates weekly. Aim for fewer than 2 false alerts per week while catching 95% of genuine anomalies.
Detection signals beyond raw volume
Volume alone doesn't tell the full story. A steady 50 tickets per hour might hide a brewing crisis if they're all coming from enterprise accounts or all about the same critical feature.
Additional detection layers that catch problems volume metrics miss:
Velocity changes Track acceleration, not just current state. If you normally add 5 tickets per hour but suddenly jump to 15, that acceleration matters more than the absolute number.
Concentration signals
-
Single category consuming 60%+ of new tickets
-
One customer segment generating 40%+ of volume
-
Specific error messages appearing in 30%+ of tickets
Sentiment deterioration When negative language spikes above baseline even without volume changes. Words like "frustrated," "unacceptable," "third time" appearing at 2x normal rate signals something brewing before it shows up in the queue.
Response time degradation First response time increasing 50% above baseline even with normal volume suggests agent capacity issues or ticket complexity changes.
Escalation rate changes Normal escalation rate might be 8-12% of tickets. Jumping to 20% indicates either agent struggles or a severity increase you haven't caught yet.
A payments processor tracking around 4,500 monthly tickets caught a major issue 3 hours earlier by detecting sentiment degradation in merchant tickets before volume spiked. The phrase "customers complaining" appeared in 15 tickets within 30 minutes — their model flagged this as 5x normal concentration.
Automated routing playbooks that execute without manual intervention
Detection without action is just expensive monitoring. The gap between knowing about a spike and actually doing something useful determines whether you contain the problem or let it cascade.
Effective routing playbooks operate on IF-THEN logic with specific triggers and predetermined actions:
Tier 1: Early Warning (2-sigma deviation)
-
Auto-notification to team lead via Slack/Teams
-
Dashboard status changes to yellow
-
Overflow queue activated for next 30 minutes
-
Non-urgent ticket types auto-delayed by 2 hours
Tier 2: Active Response (3-sigma or sustained 2-sigma)
-
All available agents pulled from projects
-
Tier 2 agents authorized for tier 1 tickets
-
Auto-response templates activated for common issues
-
Callback queue suspended for 1 hour
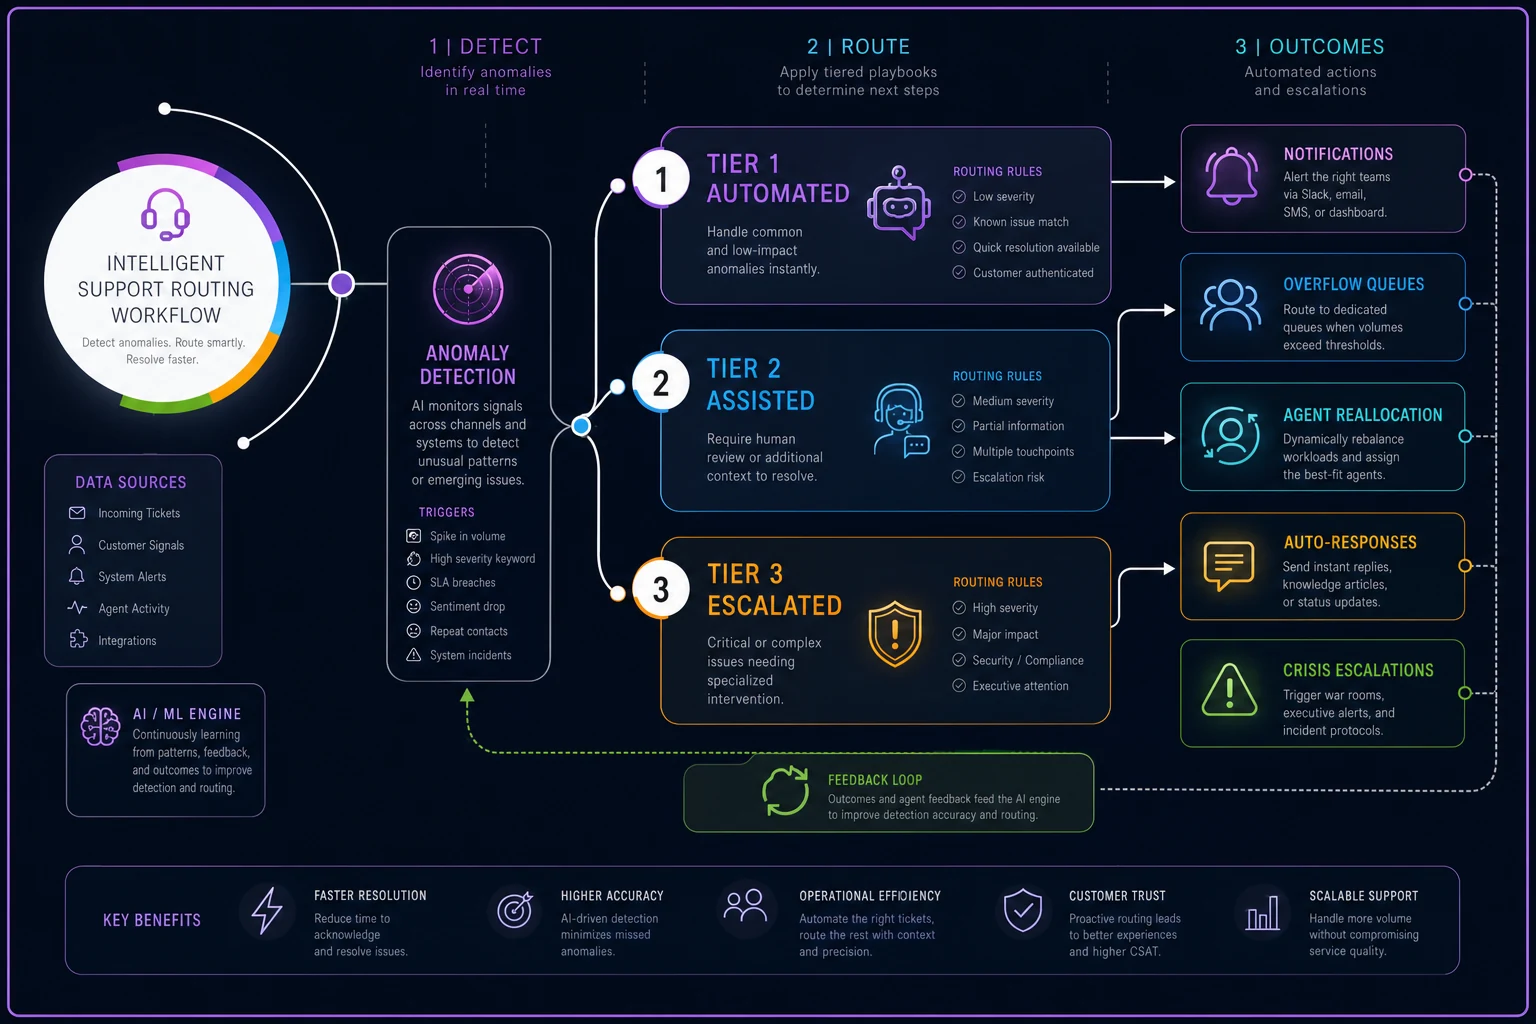
This diagram shows how detection triggers map to playbook actions.
Tier 3: Crisis Mode (4-sigma or cascade indicators)
-
All hands escalation to management
-
Emergency contractor pool activated
-
Non-critical ticket types auto-closed with apology/credit
-
Phone lines switched to callback-only mode
-
Status page updated with incident notice
The key is making these transitions automatic based on data triggers, not subjective judgment calls. When someone has to decide "is this bad enough to escalate?" you've already lost 30-60 minutes of response time.
Short-term mitigations that buy time for real fixes
Anomaly detection helps you respond faster, but you still need operational tactics that reduce immediate pressure while root causes get addressed. These aren't permanent solutions — they're pressure valves that prevent total system failure.
Auto-response filtering When specific ticket types spike, auto-response templates can deflect 30-40% of volume. But this only works if you:
-
Match templates to specific detected patterns
-
Include clear escalation paths for unsolved issues
-
Set expiration times (auto-responses shouldn't run for days)
-
Track deflection rates to ensure they're actually helping
A meal kit service seeing 300% spikes during holiday weeks auto-responds to all "where's my box" tickets with tracking links and expected delays. This deflects roughly 45% of spike volume, buying agents time for complex issues.
Intelligent work shifting Move non-urgent work based on spike detection:
-
Pause outbound follow-ups
-
Delay non-critical ticket types by 4-24 hours
-
Shift quality reviews to next day
-
Postpone training sessions
-
Convert phone agents to ticket handling
Dynamic staffing triggers Connect detection to staffing decisions:
-
2-sigma
Approve overtime for next shift
-
3-sigma
Call in on-call agents
-
4-sigma
Activate contractor pool
-
Sustained anomaly
Trigger emergency hiring
Channel throttling Temporarily limit intake channels to manage flow:
-
Increase chat queue times
-
Switch phones to callback mode
-
Disable low-priority contact forms
-
Add friction to non-urgent paths
These mitigations work because they're triggered by data, not panic. The system decides when to activate them based on statistical patterns, removing the hesitation and debate that normally delays response.
Common detection failures that create false confidence
Setting up detection that looks sophisticated but misses actual problems usually happens when teams focus on technical metrics instead of operational realities.
Averaging across unlike patterns Combining all ticket types into one baseline means billing spikes get hidden by technical support lulls. Segment detection by category, channel, and priority — otherwise you're detecting average changes, not actual problems.
Ignoring compound signals Volume might be normal but if response time, escalation rate, and sentiment all degrade simultaneously, something's wrong. Single-metric detection misses cascading failures.
Over-tuning to recent data Using only last month's data for baselines means you miss seasonal patterns. December baselines built from November data will fire constantly. You need at least 90 days, preferably 6-12 months.
Static thresholds in dynamic operations If your business is growing 10% monthly, last quarter's baselines are already obsolete. Build in growth adjustments or use rolling windows that adapt automatically.
Alert fatigue from poor prioritization Sending every 2-sigma deviation to everyone means real problems get lost in noise. Route alerts based on severity and sustained duration, not just mathematical deviation.
Building detection into operational DNA
Companies that handle spikes smoothly don't treat anomaly detection as a separate monitoring project - they embed it into daily operations where it actually drives decisions.
Start with one high-impact area where spikes cause immediate pain. For most teams, that's Monday morning surge, post-release spikes, or billing cycle peaks. Build detection for that specific pattern, create automated responses, then expand from there.
A subscription software company started with just billing ticket detection. They found that payment failure tickets spiking above 20 per hour (compared to a normal 5-8) predicted processor issues 85% of the time. That single detector triggering automated merchant notifications prevented four major incidents from cascading into hundred-ticket backlogs.
-
Is this abnormal for this specific time and context?
-
How bad will it get if we don't act now?
-
What's the minimum intervention needed to contain it?
Without answers to all three, you're just building elaborate dashboards that tell you about problems after customers have already suffered through them.
The compound effect of early detection
Anomaly detection isn't about preventing all spikes — it's about catching them early enough that your responses actually work. The difference between responding at 50 tickets versus 200 tickets determines whether you solve problems in hours or days.
Teams that implement contextual baselines, multi-signal detection, and automated responses typically see:
-
60-70% reduction in time-to-detect for major issues
-
40% reduction in peak queue sizes during spikes
-
50% fewer customer escalations during incidents
-
30% improvement in SLA adherence during surge periods
The real value isn't in those numbers though — it's in shifting from reactive scrambling to something that actually resembles proactive management. When your team knows the system will catch problems and trigger appropriate responses, they stop living in constant fear of the next spike.
Statistical detection tuned to your actual patterns, combined with automated routing and short-term mitigations, creates operational resilience that handles spikes without requiring heroics. The goal isn't perfect prediction — it's early enough detection that standard responses actually work.
The businesses still firefighting every spike are the ones relying on manual monitoring and fixed thresholds. The ones handling surges smoothly have built detection systems that understand context, trigger automatically, and buy time for proper fixes. That gap doesn't close on its own.
Ready to elevate your customer support?
Join 2,000+ support teams using Helpyly to reduce response times, automate workflows, and deliver outstanding customer experiences.