


Most support metrics fail long before anyone argues about whether CSAT or NPS is the "right" number. They fail because the data underneath is quietly broken. A queue rename in your ticketing tool three months ago silently split "First Response Time" into two incompatible definitions. A timezone bug shifted half your resolution timestamps by five hours. Someone changed how "reopened" is counted and nobody told the analytics team. By the time a director notices the dashboard looks weird, the number has already been wrong for six weeks and three decisions have been made on top of it.
This is the part of support operations nobody wants to own. It's not customer-facing, it doesn't show up in a QBR slide, and it feels like engineering's job. But if you're a support manager whose staffing forecasts, SLA reports, and headcount asks all run off the same tables, you're the one who gets burned when those tables drift. A support data platform — the schema, the pipelines, the tests, and the alerting around your operational data — is what decides whether your metrics are trustworthy or just decorative.
This article is the plumbing layer. It covers canonical event schemas, SQL tests you can actually run, SLO recipes for the data itself (not just the tickets), and a runbook for when the pipeline breaks at 2 a.m. before the Monday leadership report.
Why support data breaks in ways that other data doesn't
Support data has a specific set of problems that make it messier than, say, billing data. Billing events are relatively few, high-value, and heavily validated. Support events are high-volume, low-individual-value, and generated by humans clicking buttons in inconsistent ways across email, chat, phone, and social.
-
The same event has three names. A ticket "closed," "resolved," and "solved" might mean the same thing in your tool — or three different things depending on which macro the agent used. Nobody wrote it down.
-
Timestamps come from different clocks. Your chat widget stamps in UTC, your phone system in the local office timezone, and your CRM in whatever the user's browser reported. Join those without normalizing and your handle-time distribution grows a phantom second peak.
-
Late-arriving data. A phone call transcript lands 40 minutes after the call ended. A social mention gets ingested the next morning. If your daily pipeline runs at midnight, yesterday's numbers are incomplete and today's backfill silently rewrites history.
-
Merges and splits. Agents merge duplicate tickets and split multi-issue threads constantly. Every merge orphans an ID that some downstream report is still counting.
None of these are exotic. What makes them dangerous is that they don't throw errors. The pipeline runs green, the dashboard loads, and the number is just quietly wrong. That's the failure mode a real support data platform is built to catch.
Start with a canonical event schema
The single highest-leverage thing you can do is define a canonical event model — one place that says "here is what a support event looks like, no matter which channel it came from." Everything else (tests, SLOs, reports) hangs off this.
Never let a customer request slip through the cracks.
Helpyly helps you track, resolve, and optimize every support interaction effortlessly.
- Centralized ticket management
- Automated customer notifications
- Performance analytics dashboard
No credit card required
Model events, not tickets. A ticket is a mutable object that changes state over its lifetime; an event is an immutable fact that happened at a point in time. If you store the current state of a ticket, you can never reconstruct what the queue looked like last Tuesday. If you store events, you can rebuild any point in time by replaying them.
``sql
CREATE TABLE supportevents (
eventid STRING NOT NULL, -- unique, idempotent key
eventtype STRING NOT NULL, -- created | firstresponse | reassigned
-- reopened | resolved | closed | merged
occurredat TIMESTAMP NOT NULL, -- UTC, source-of-truth time
ingestedat TIMESTAMP NOT NULL, -- when we received it
conversationid STRING NOT NULL, -- stable thread identifier
channel STRING NOT NULL, -- email | chat | phone | social
queue STRING,
assigneeid STRING,
priority STRING,
actortype STRING, -- customer | agent | system
mergedinto_id STRING, -- set only on merge events
attributes JSON -- channel-specific extras
);
``
-
event_idmust be idempotent. If the same event gets replayed during a backfill, inserting it twice should be a no-op. This is what lets you re-run a broken pipeline without double-counting. -
occurredatandingestedatare separate columns. The gap between them is your late-arrival signal. When that gap widens, something upstream is lagging. -
conversation_idis the stable spine. This is the same concept behind treating conversations as canonical objects rather than channel-specific records — worth reading more on in the piece on canonical conversation objects and timeline-stitching. Without a stable spine, cross-channel journeys fall apart. -
mergedintoidlets you follow a merge chain instead of losing the ticket entirely.
Enforce an enum on event_type. The moment you allow free-text event names, you've reopened the door to "closed" vs "resolved" vs "solved." Every new event type should require a code change and a review — not a dropdown someone edits on a Tuesday afternoon.
SQL pipeline tests that catch drift before humans do
A schema is a promise. Tests are how you check the promise is still true. The useful tests aren't clever — they're boring, specific, and run on every pipeline execution.
Group them into three buckets: freshness, volume, and integrity.
Freshness: is the data actually current?
``sql
-- Alert if the newest event is more than 90 minutes old
SELECT
MAX(occurredat) AS latestevent,
TIMESTAMPDIFF(CURRENTTIMESTAMP(), MAX(occurredat), MINUTE) AS lagminutes
FROM supportevents
HAVING lagminutes > 90;
``
If this returns a row, your pipeline is stale. This one test catches the most common silent failure: the ingestion job died and nobody noticed because the last-known-good data still renders fine.
Volume: is the number of events sane?
``sql
-- Compare today's hourly event count to the trailing 4-week baseline
WITH hourly AS (
SELECT DATETRUNC(occurredat, HOUR) AS hr, COUNT() AS n
FROM supportevents
WHERE occurredat >= CURRENTTIMESTAMP() - INTERVAL 28 DAY
GROUP BY hr
),
baseline AS (
SELECT EXTRACT(HOUR FROM hr) AS hod,
AVG(n) AS avgn, STDDEV(n) AS sdn
FROM hourly
WHERE hr < DATETRUNC(CURRENTTIMESTAMP(), DAY)
GROUP BY hod
)
SELECT h.hr, h.n, b.avgn
FROM hourly h JOIN baseline b
ON EXTRACT(HOUR FROM h.hr) = b.hod
WHERE h.hr >= DATETRUNC(CURRENTTIMESTAMP(), DAY)
AND (h.n < b.avgn - 3 b.sdn OR h.n > b.avgn + 3 * b.sdn);
``
A sudden drop to zero events at 10 a.m. on a weekday almost always means a broken channel connector, not a quiet customer base. A sudden spike might be a genuine incident — or a replay bug double-inserting.
Integrity: do the events make sense together?
``sql
-- Every conversation with a resolved event should have a created event first
SELECT r.conversationid
FROM (SELECT conversationid, MIN(occurredat) AS resolvedat
FROM supportevents WHERE eventtype = 'resolved'
GROUP BY conversationid) r
LEFT JOIN (SELECT conversationid, MIN(occurredat) AS createdat
FROM supportevents WHERE eventtype = 'created'
GROUP BY conversationid) c
ON r.conversationid = c.conversationid
WHERE c.createdat IS NULL
OR c.createdat > r.resolvedat;
``
``sql
-- Duplicate eventids should never exist
SELECT eventid, COUNT(*) AS n
FROM supportevents
GROUP BY eventid
HAVING n > 1;
``
The "resolved before created" test catches timezone and clock-skew bugs well. If you suddenly see a batch of conversations resolved before they existed, someone changed a timestamp source upstream.
Run these as blocking checks. If integrity fails, the downstream reporting tables shouldn't refresh — a stale-but-correct dashboard beats a fresh-but-wrong one every time. That same discipline is what keeps support KPIs tied to decisions instead of guesswork.
SLOs for the data, not just the tickets
Everyone sets SLAs on ticket response time. Almost nobody sets SLOs on the data pipeline that measures those SLAs — which is backwards, because a broken pipeline can make you think you're missing SLAs when you aren't, and vice versa.
Define a handful of data SLOs with explicit targets, measurement windows, and what happens when you burn through the error budget.
| Data SLO | Target | Measurement window | Verification |
|---|---|---|---|
| Freshness | 99% of the day, latest event < 90 min old | Rolling 30 days | Freshness query above, sampled every 15 min |
| Completeness | ≥ 99.5% of expected daily events present after backfill | Daily, T+1 | Volume vs 4-week baseline within 2 SD |
| Accuracy | < 0.1% of conversations fail integrity checks | Daily | Integrity test suite pass rate |
| Reconciliation | Row counts match source system within 0.5% | Daily | Count(*) diff vs source API export |
Don't set freshness to 100% — you'll be paged constantly for a two-minute connector hiccup that self-heals. The 99% target gives you roughly 15 minutes of allowable staleness per day, which absorbs normal noise while still catching real outages.
The reconciliation SLO is the one teams skip and regret. It compares your platform's row counts back against the source system directly. Pipelines have a habit of slowly losing 1–2% of records to silent filter bugs, and nothing internal to your platform will ever catch it — because from the platform's perspective, everything looks consistent. Only an external comparison catches quiet leakage.
When strict SLOs make sense — and when they don't
If your support data drives staffing decisions, executive reporting, or contractual SLA credits, tight SLOs are worth the operational cost. The downside of being wrong is real money or real trust.
If you're a small team using support data mostly for directional gut-checks, full SLO machinery is overkill. You'll spend more time tuning alert thresholds than you'll ever save. Keep just the freshness and duplicate-ID checks and skip the rest until volume grows. The mistake isn't skipping SLOs when you're small — it's forgetting to add them back when a director suddenly starts making headcount decisions off a dashboard nobody validated.
An incident runbook for pipeline failures
When the pipeline breaks, the worst outcome isn't the outage — it's three people independently poking at it while a fourth quietly re-runs a job that corrupts the backfill. A runbook exists so the response is boring and coordinated.
``text
Pipeline failure detected
|
v
Confirm failure is real (wait one cycle)
|
v
Freeze downstream report refreshes
|
v
Assign single incident owner
|
v
Identify failure boundary: ingestion / transformation / load
|
v
Check last 24–48 hours of changes
|
v
Backfill idempotently, run duplicate-ID test
|
v
Run full test suite → reconcile against source
|
v
Unfreeze reports → document timeline
``
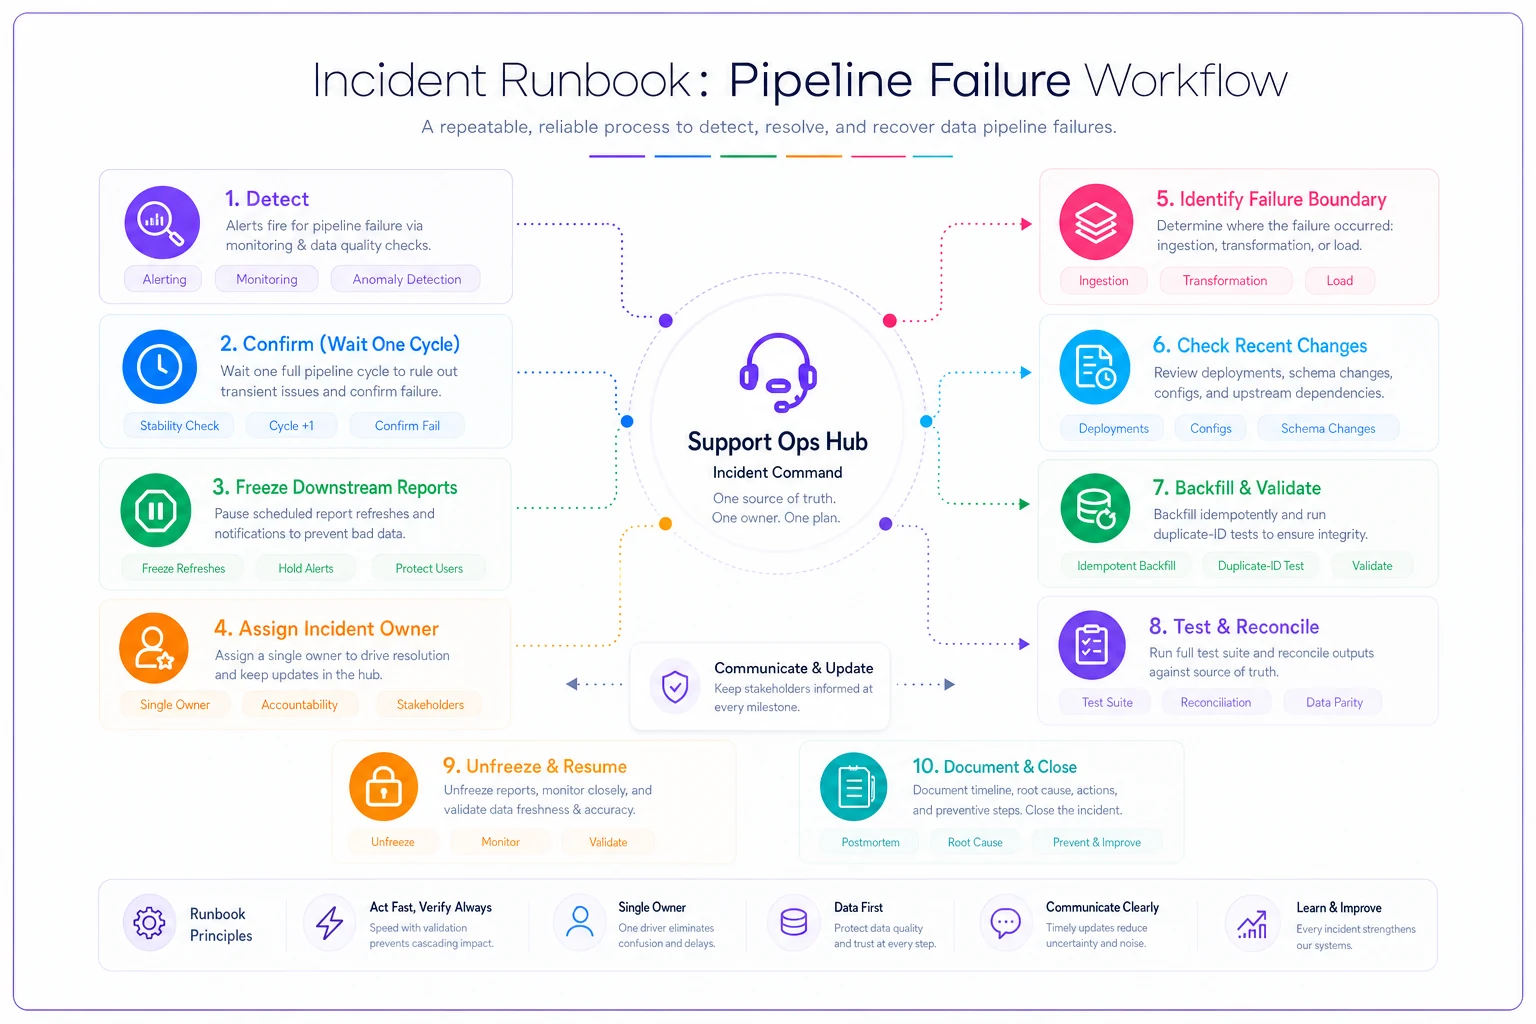
A quick visual of that incident workflow:
-
Confirm the failure is real. Check whether it's a failed freshness SLO or a hard job error. A momentarily stale query might resolve itself in the next run — wait one cycle before declaring an incident.
-
Freeze downstream refreshes. Stop the reporting tables from rebuilding on bad or partial data. A stale dashboard is safe; a wrong one is not.
-
Assign one owner. One person drives, everyone else observes. This is the single biggest determinant of how fast pipeline incidents resolve.
-
Identify the boundary. Is the break at ingestion (source connector down), transformation (a bad schema change), or load (warehouse issue)? The three failure zones have completely different fixes.
-
Check the last change. Most pipeline breaks trace to a change made in the last 24–48 hours — a schema tweak, a renamed queue, a new channel. Look there first before assuming infrastructure.
-
Backfill idempotently. Because
event_idis idempotent, re-run the affected window without fear of double-counting. Verify with the duplicate-ID test after. -
Re-enable downstream and verify. Run the full test suite before unfreezing reports. Confirm reconciliation against source before telling anyone the numbers are trustworthy again.
-
Write the timeline. Capture what broke, when, the blast radius (which reports were affected and for how long), and what change caused it.
The step people skip is #2, freezing downstream. It feels counterproductive during an outage to stop things from running. But an unfrozen pipeline chugging away on partial data is how a two-hour connector blip becomes a two-week data-quality investigation.
A verification checklist before you declare "all clear"
-
- [ ] Freshness query returns no rows (data is current)
-
- [ ] Zero duplicate
event_ids -
- [ ] No "resolved before created" integrity violations
-
- [ ] Daily volume within 2 SD of the 4-week baseline
-
- [ ] Source reconciliation within 0.5%
-
- [ ] Affected reporting tables rebuilt and spot-checked
-
- [ ] Incident timeline documented with root-cause change identified
Don't unfreeze reports until every box is checked. "It looks fine now" is not a verification step.
A real scenario
A mid-sized SaaS support team — around 22 agents, handling roughly 9,000–10,000 tickets a month across email and chat — ran their weekly staffing and SLA reports off tables that pulled directly from their helpdesk's raw export. No canonical layer, no tests.
The problem surfaced when their reported First Response Time suddenly "improved" by about 18% overnight, with no operational change. Leadership nearly cut a planned contractor extension based on the apparent gain. What had actually happened: a helpdesk update changed how automated acknowledgment emails were logged, and those auto-acks started counting as first responses. The metric wasn't better — it was measuring a robot.
They rebuilt around an event-based schema with occurredat/ingestedat separation and added the freshness, duplicate, and integrity tests described above. Two things changed. That specific bug got caught the next time it recurred — the integrity suite flagged a wave of firstresponse events with actortype = system, and the report was frozen before anyone saw a false number. And the backfill discipline meant a chat connector outage a month later — which previously would've silently dropped a few hundred events — was detected within about 20 minutes and fully recovered without corrupting history.
No dramatic revenue story. The win was simpler: leadership stopped making staffing calls off numbers that turned out to be artifacts, and the support manager stopped spending Monday mornings explaining why the dashboard looked strange.
Where this fits in the bigger operation
A support data platform isn't a standalone project — it's the foundation everything else quietly stands on. Staffing forecasts, QA sampling, SLA credits, product feedback loops — all of it consumes this data. When the schema drifts or the pipeline silently drops rows, the damage doesn't show up as an error. It shows up as a slightly-wrong decision three steps downstream, made by someone who trusted the number.
The teams that get this right treat their data like any other production system: schema under version control, tests that block on failure, SLOs with real targets, and a runbook so incidents resolve the same way every time instead of turning into a scramble. It's not glamorous work. But it's the difference between metrics you can bet a headcount request on and metrics that are just numbers on a screen.
Start small if you need to — a canonical event table, a freshness check, and a duplicate-ID test will catch most of the failures that actually burn people. Add SLOs and reconciliation when the stakes of being wrong get high enough. The goal isn't a perfect platform. It's making sure that when someone asks "can we trust this number?" the answer is yes, and you can prove it.
Ready to elevate your customer support?
Join 2,000+ support teams using Helpyly to reduce response times, automate workflows, and deliver outstanding customer experiences.