

Most support leaders lose budget arguments not because their case is weak, but because they show up speaking a different language than the person holding the budget. You talk deflection rate and CSAT. The CFO hears "soft metrics" and moves on. The gap isn't intelligence or effort — it's that support unit economics rarely get translated into the finance vocabulary that actually drives resource decisions: cost per unit, net present value, payback period, dollar impact on retained revenue.
This article is about building repeatable financial models that close that gap. Not a one-time deck you scramble together before a budget meeting, but a small library of reusable templates — cost-per-ticket calculators, NPV models for automation projects, sensitivity analyses, and decision thresholds tied to churn and NRR. Once you have these, every future decision runs through the same math, and you stop reinventing the argument every quarter.
Why support keeps losing the budget conversation
Support gets treated as a cost center by default. That framing is hard to fight when the only numbers you bring are volume and satisfaction scores. Finance can't do anything with "our CSAT is 92%." They can do a lot with "each avoided ticket saves us roughly $9, and this project avoids about 14,000 tickets a year."
The deeper issue is that support economics are genuinely messy to calculate, so most teams either don't do it or do it inconsistently. Fully-loaded cost per ticket isn't just agent salary divided by tickets. It includes tooling, QA overhead, management time, benefits, escalation costs, and the revenue consequences of slow or bad resolutions. When you skip the messy parts, your numbers look either naively cheap or indefensibly padded — and finance discounts both.
The support orgs that consistently win budget aren't the ones with the best tooling. They're the ones with a consistent model they update every quarter. Consistency builds trust. When your cost-per-ticket number moved from $11 to $9.40 and you can explain exactly why, finance starts treating your projections as real forecasts instead of wishful thinking.
Start with a fully-loaded cost-per-ticket calculator
Everything downstream depends on getting this one number reasonably right. Cost per ticket is the atomic unit of support economics, and almost everyone underestimates it because they only count agent wages.
Never let a customer request slip through the cracks.
Helpyly helps you track, resolve, and optimize every support interaction effortlessly.
- Centralized ticket management
- Automated customer notifications
- Performance analytics dashboard
No credit card required
A more honest breakdown of what belongs in the calculation:
| Cost component | What to include | Often forgotten? |
|---|---|---|
| Direct labor | Agent salary + benefits + payroll taxes | No |
| Management overhead | Team lead / manager time allocated to support | Yes |
| QA & coaching | Reviewer time, calibration sessions, training hours | Yes |
| Tooling | Helpdesk, phone system, KB software, analytics | Sometimes |
| Escalation cost | Eng/product time pulled into tickets | Almost always |
| Facilities/IT | Laptops, seats, software licenses | Yes |
Keep the channel breakouts (phone, chat, email) as separate tabs in your calculator so stakeholders can see the cost differences at a glance.
A practical way to build the calculator: take a month of fully-loaded support spend, divide by resolved ticket volume for that month. Do it by channel too, because a phone ticket and a chat ticket are not remotely the same cost. In practice, a phone contact often runs 3–5x the cost of a well-handled chat or email — which is exactly the kind of thing that reframes a "let's add more phone coverage" request.
A typical example: a 12-person SaaS support team resolving around 9,000 tickets a month. Direct labor lands near $58k. Add management, QA, tooling, and a conservative estimate of escalation time, and the fully-loaded number climbs to roughly $84k. That's about $9.30 per ticket — versus the $6.40 you'd get counting only agent wages. That $2.90 gap is the difference between an automation project looking marginal and looking obviously worth funding.
One mistake to avoid: don't blend all channels into a single average and then use that average to justify channel-specific decisions. The average hides exactly the information you need.
Build an NPV model for automation projects
Once you have a defensible cost per ticket, you can evaluate automation projects the way finance evaluates everything else — by whether the future savings, discounted to today's dollars, exceed the cost.
Support teams tend to pitch automation as "it'll deflect 20% of tickets." Finance doesn't fund deflection percentages. They fund positive-NPV investments with a reasonable payback period. So you translate.
A reusable automation NPV template follows this process:
-
Estimate the baseline. Annual ticket volume for the category you're targeting, times fully-loaded cost per ticket. This is your "do nothing" spend.
-
Estimate realistic deflection or time savings. Be conservative. If a vendor promises 40%, model 20–25% and let reality surprise you upward.
-
Convert to annual savings. Deflected tickets × cost per ticket, plus any handle-time reduction on tickets that still come through.
-
Subtract ongoing costs. Software licensing, maintenance, and the human time required to keep content and rules updated. Automation is never free to run.
-
Account for the upfront cost. Implementation, integration, internal build time.
-
Discount future cash flows. Apply your company's discount rate (ask finance — it's often somewhere around 10–15%) across a 3-year horizon.
-
Calculate NPV and payback period. Positive NPV means fund it. Payback under roughly 12 months usually gets fast approval.
A grounded example: suppose you're automating password-reset and billing-status tickets, about 2,400 a month combined. At $9.30 loaded, that's roughly $268k of annual handling cost. Model a conservative 30% deflection — call it $80k in annual savings. Subtract $18k/year for tooling and content upkeep, netting about $62k. If implementation runs $25k upfront, you're cash-positive inside five months, and the 3-year NPV stays comfortably positive even after discounting.
The reason to templatize this is that you'll run it dozens of times. The category changes, the deflection assumption changes, the vendor cost changes — but the model structure stays fixed. That's what makes it repeatable rather than a heroic one-off analysis.
Don't skip the sensitivity analysis
The single biggest credibility killer in a support business case is a model with one deflection number baked in as fact. Everyone in the room knows your 30% assumption is a guess. If you present it as certainty, you lose. If you present it as a range with an explicit downside, you win — because you've shown you understand the risk better than they do.
-
Pessimistic (18% deflection, higher upkeep) still slightly positive NPV, roughly 9-month payback
-
Expected (30% deflection) strong NPV, roughly 5-month payback
-
Optimistic (42% deflection) excellent NPV, under 4 months
Walking in and saying "even in our worst-case scenario, this pays back within a year" does more for approval than any polished slide. It tells finance you've stress-tested your own idea and it survives.
Support leaders who lose funding have usually presented optimistic numbers as their base case. When reality underperformed, they lost credibility for the next two or three requests. Modeling the downside protects your future self as much as it strengthens today's pitch.
Tie decision thresholds to churn and NRR
This is where support economics stop being purely a cost story and become a revenue story — which is the framing that actually changes how executives think about your team.
Support quality affects retention. Slow resolutions, repeated escalations, and unresolved issues push customers toward churn. Attach even a rough dollar value to that and your models get dramatically more persuasive, because now you're not just saving costs — you're protecting net revenue retention.
The connection is straightforward: a customer files a ticket → resolution speed and quality shape their experience → that experience feeds into renewal probability → renewal probability rolls into NRR → NRR is what your board watches most closely. Support sits at the front of that chain, which means support decisions have downstream revenue consequences most models never account for.
You don't need perfect attribution to make this real. Segment your customers and compare renewal rates for accounts that had a poor support experience (long resolution times, multiple reopens, escalations) against those that didn't. There's usually a measurable gap — accounts with rough support experiences renew at a noticeably lower rate. Even a couple of percentage points of churn difference, applied to your average account value, produces a number worth defending an SLA over.
That lets you build decision thresholds. For example: "Any account above $40k ARR that hits a second escalation gets senior ownership within 2 hours." You justify that threshold financially — the retained-revenue value of protecting those accounts outweighs the labor cost of the faster response. This connects directly to how escalation ownership and routing reduce churn, and it's the kind of rule that only survives scrutiny when there's a churn-linked number behind it.
Build a run-rate model so nothing surprises you
Cost-per-ticket and NPV are great for decisions. A run-rate model is what keeps you honest month to month and lets you forecast where support spend is heading before it becomes a problem.
A run-rate model projects your support cost forward based on ticket volume trends, headcount, and the automation initiatives you've committed to. It answers the question executives always ask mid-year: "If nothing changes, what does support cost us next quarter?"
The core inputs are straightforward: current monthly ticket volume, growth rate in tickets (often tied to customer growth, though not always linearly), cost per ticket, planned headcount changes, and the modeled impact of any automation going live. Project those out and you get a forward-looking cost curve.
The insight most teams miss: ticket volume rarely grows at the same rate as revenue. Product improvements bend the curve down, while new feature launches and customer growth bend it up. Seasonal patterns complicate things further — which is why run-rate models pair naturally with forecasting formulas and seasonal staffing plans. If your run-rate model assumes flat seasonality, it will be wrong in exactly the months you can least afford it.
A useful checklist for a run-rate model that actually holds up:
-
Ticket volume broken out by channel, not blended
-
Growth rate validated against actual customer and usage trends, not assumptions
-
Cost per ticket updated at least quarterly
-
Automation impact modeled with the same conservative deflection you used in NPV
-
Seasonality explicitly built in, not averaged away
-
Planned headcount changes with realistic ramp time (new agents aren't fully productive on day one)
-
A clearly marked "do nothing" baseline for comparison
If your run-rate model assumes flat seasonality, it will be wrong in exactly the months you can least afford it.
Where the numbers actually come from
All of this depends on data you can trust, and that's usually the real bottleneck. If your ticket categorization is inconsistent, your channel costs are guesses, and resolution times aren't reliably logged, every model above inherits that noise.
This is where your operational systems matter more than the spreadsheets. Fully-loaded cost per ticket requires clean volume data by channel. Churn-linked thresholds require joining support history to account revenue. Run-rate models require trustworthy trend data over time.
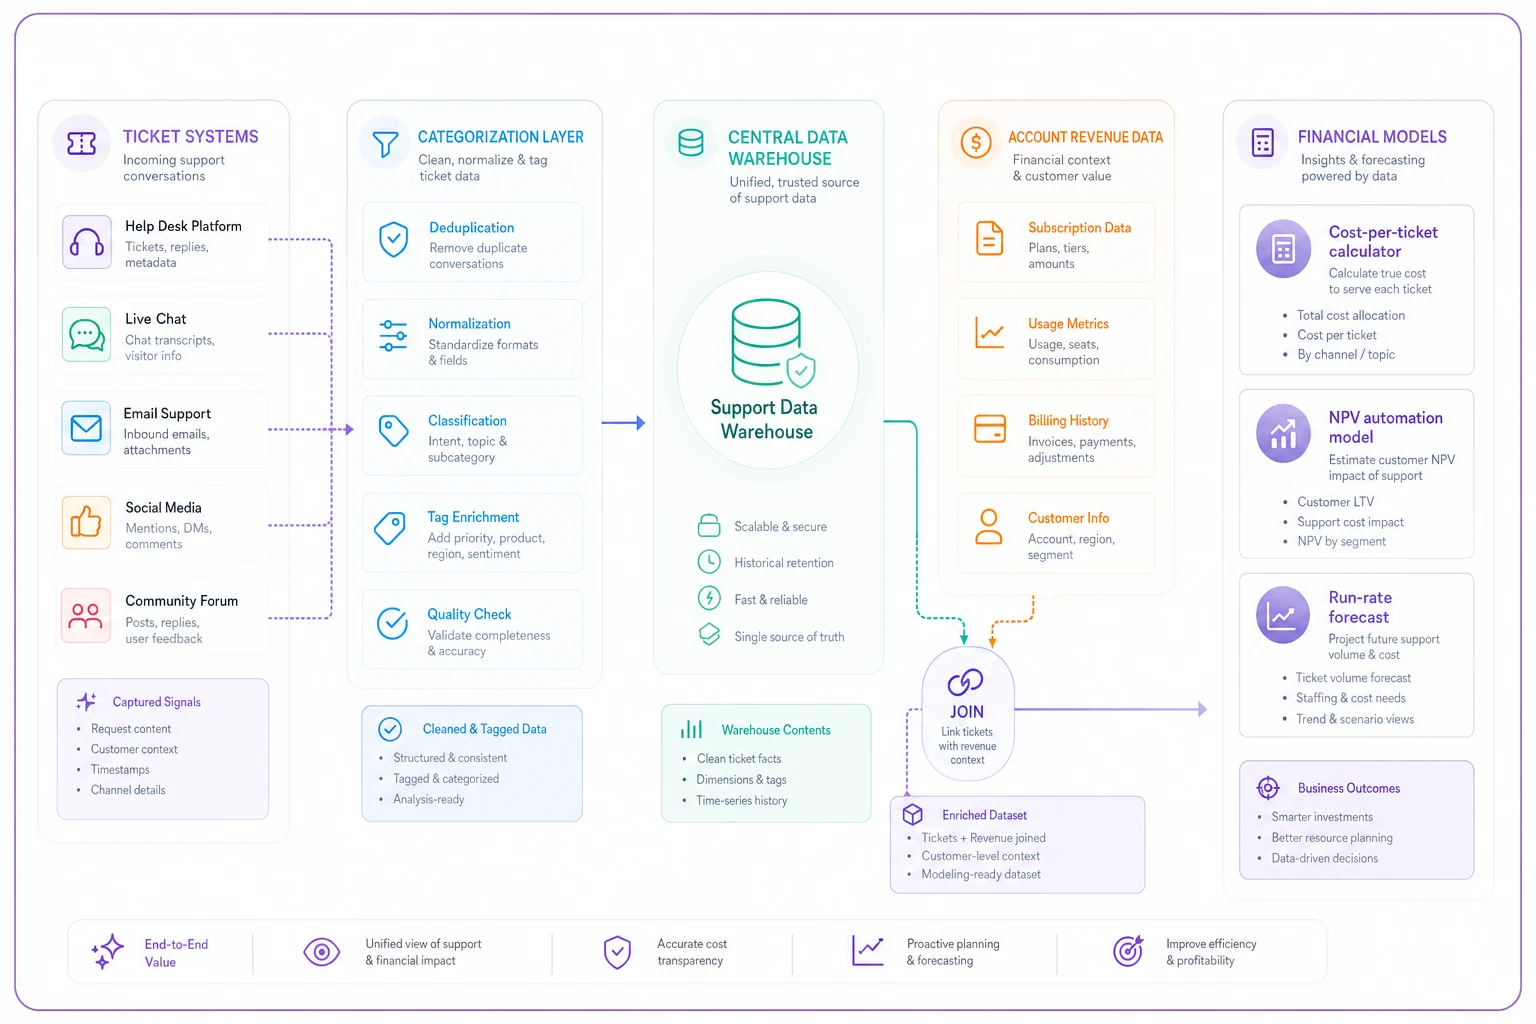
This simple illustration shows the flow from raw ticket data to finance-grade models so stakeholders see where each number originates.
The point isn't the tooling for its own sake. Finance-grade models require finance-grade data, and most support teams can't produce reliable cost-per-ticket numbers because their underlying data is too messy to trust. Fix the foundation before you build the models, or you'll end up with precise numbers that are confidently wrong.
When this is worth it — and when it isn't
Building a full model library makes sense once your support spend is large enough that decisions carry real dollars. If you're a five-person team spending under $30k a month, a full NPV-and-sensitivity apparatus is overkill. A simple cost-per-ticket number and a rough deflection estimate will do fine.
Where it becomes essential: teams above roughly $1M in annual support spend, teams making six-figure automation or headcount decisions, and any team that keeps losing budget arguments. At that scale, the difference between a modeled decision and a gut-feel decision is measured in tens of thousands of dollars.
Who should be careful: teams with unreliable data. If your ticket categorization is a mess and resolution times aren't logged consistently, fix the data foundation first. Building sophisticated models on garbage inputs produces confident, precise, wrong numbers — which is worse than admitting you don't know yet, because it burns credibility when reality diverges.
A real scenario
A mid-sized B2B software company with around 40 support agents had tried twice to justify an automation investment for their most repetitive ticket categories. Their original pitch — "this will deflect 35% of Tier 1 tickets" — got shelved both times because finance couldn't map it to dollars.
They rebuilt the case around unit economics. Fully-loaded cost per ticket came out to about $8.70, higher than anyone expected once escalation and management time were included. Their target categories were running close to $310k a year. Modeled at a conservative 25% deflection with realistic upkeep costs, the project netted somewhere around $65k–$70k in annual savings, with a 3-year NPV that held positive even in the pessimistic sensitivity scenario. They also attached a modest churn benefit by showing that faster Tier 1 resolution correlated with slightly better renewal rates on mid-market accounts.
The project got approved in the next budget cycle. But the more valuable outcome was that the models stuck around. The next two requests — a QA tooling upgrade and a small headcount addition — ran through the same templates. Approval time dropped noticeably because finance already trusted the framework. The team had stopped pitching and started forecasting.
The shift that actually matters
The real change isn't any single calculator. It's moving support from a team that reacts to budget pressure to one that forecasts its own economics and shows up with the math already done.
When you can hand finance a fully-loaded cost per ticket, an NPV with honest sensitivity ranges, and a churn-linked justification for your service thresholds, the conversation stops being about whether support is worth the money and starts being about which of your positive-NPV projects to fund first. That's a meaningfully different room to be in.
Build the templates once. Update the inputs every quarter. The models compound in credibility the same way good financial forecasts do — each accurate call makes the next projection easier to trust. That's how support unit economics stop being a defensive scramble and become the language you use to actually run the operation.
Build the templates once. Update the inputs every quarter. The models compound in credibility the same way good financial forecasts do — each accurate call makes the next projection easier to trust. That's how support unit economics stop being a defensive scramble and become the language you use to actually run the operation.
Ready to elevate your customer support?
Join 2,000+ support teams using Helpyly to reduce response times, automate workflows, and deliver outstanding customer experiences.